Pitch project, April 2026
Diageo Manhattan Market Potential Index
A pitch for planning a drinks company's Manhattan marketing by ZIP code instead of one borough-wide number.
In brief
- The question
- Where in Manhattan is the opportunity for a drinks company, ZIP code by ZIP code?
- The approach
- An index that scores each of Manhattan's 43 ZIP codes on supply, demand and strategic fit, built from eight data layers and presented as an interactive scrolling page.
- The result
- The East Village was the most reliable priority, at 0.56 on both the raw and the sample-adjusted score. The Lower East Side ranked first on raw score (0.70) and fell to 0.23 once its small sample was accounted for.
The premise
The pitch is addressed to the chief marketing officer of Diageo North America. Its argument is that Manhattan investment is planned against a single borough-level number that treats all 43 ZIP codes the same, and that a contracting drinks market makes that too blunt.
The alternative it proposes is a Market Potential Index: one ranked output in which each ZIP code gets a score, a confidence range and a recommended activation pillar (premium mixology, ready-to-drink or Gen Z).
How the index is built
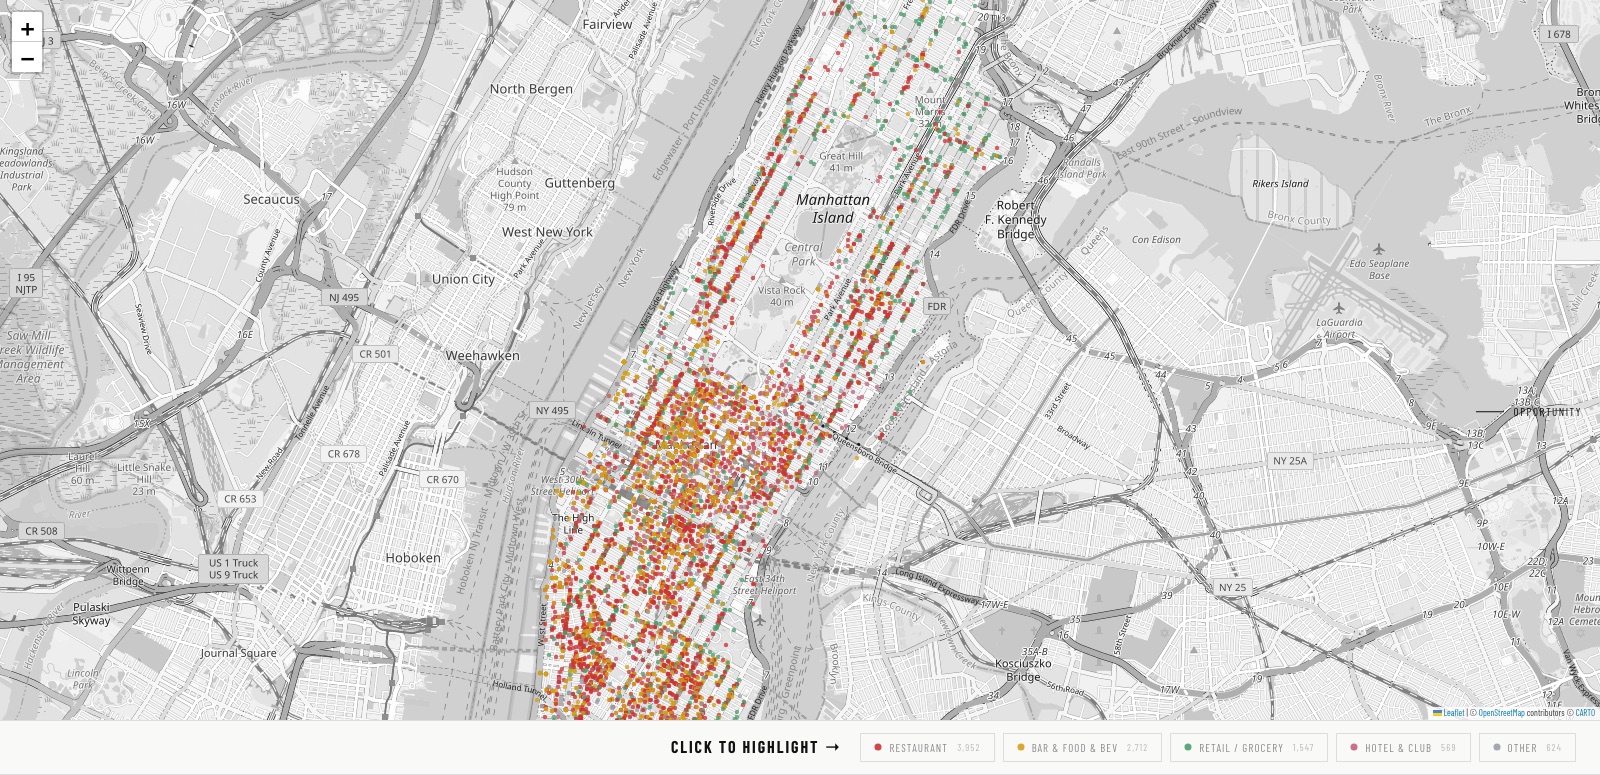
- Supply: how competitive the venue environment is, from every active on-premise licence in Manhattan mapped by type.
- Demand: whether consumers are there and engaged, from foot traffic, search interest and a primary sample of Instagram posts.
- Strategic fit: whether the ZIP code matches what the company sells, from census data on age, income and lifestyle weighted to the three activation pillars. The same ZIP code can be a high opportunity for one pillar and a low priority for another.
Working with messy data
- Eight data layers, each listed in the pitch with its coverage and its caveat: New York State liquor licences (status can lag by up to 90 days), city inspection records, Department of Transportation foot-traffic counts from 312 sensors (a pedestrian-only proxy), Census ACS demographics (a pre-2024 vintage), Yelp review density, Instagram and TikTok signals, and competitor menus.
- The Instagram sample is 124 posts scored for engagement, premium signals and cocktail context. It is hashtag-seeded and not random, and the pitch says so.
- Small samples are shrunk toward the mean by partial pooling. That is what moves the Lower East Side from first place on raw score to third: ten posts are not enough to trust a 0.70.
Decisions and why
- Every key assumption is stated so it can be challenged, including the weights in the buzz score: engagement 0.4, venue context 0.35, density-normalized post volume 0.25.
- The weights were run through a Latin-hypercube sensitivity analysis. The rank order held in 86% of permutations.
- The index is meant to be validated against real accounts before delivery. If it cannot rank-order them, that result is reported rather than shipped.
- Timing is part of the recommendation, not only place: the East Village peaks from 7 to 9 PM and Midtown from 5 to 7 PM.
The presentation
The pitch is a single scrolling web page rather than a slide deck: an interactive Leaflet map of licensed venues that can be filtered by type, charts that draw as they come into view, and a closing recommendation.
A pitch project. It is not affiliated with or endorsed by Diageo.